
How the ultrasound image is formed
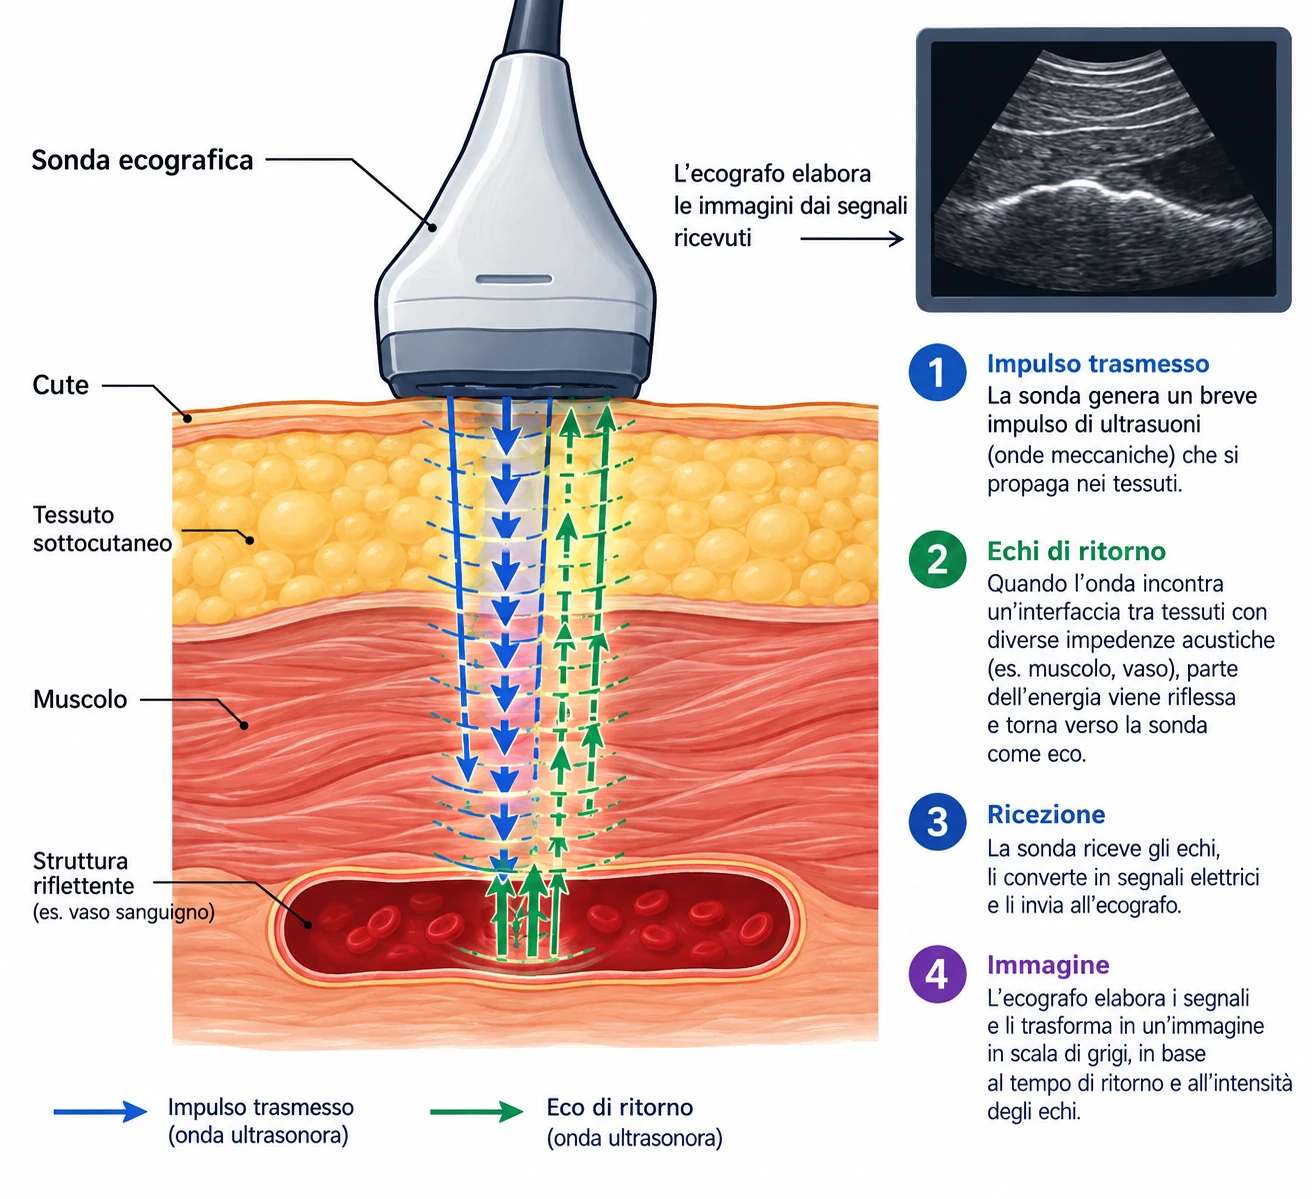
Diagnostic ultrasound uses mechanical waves with frequencies between about 2 and 15 MHz, generated and received by the same probe through piezoelectric crystals. The basic mechanism is simple: the probe emits a short pulse and then listens for the echo. From the time the echo takes to return, the scanner calculates the depth of the structure that reflected it.
L' amplitude of the returning echo depends on the difference in acoustic impedance between the tissues crossed by the ultrasound beam. The impedance difference between blood and vessel wall is small. Blood does not reflect like a mirror: red blood cells scatter a tiny fraction of the energy in all directions, and it is precisely this weak signal that Doppler analyses. Other tissues, such as bone and air, block the beam almost completely (hence the complete shadow behind bone and the impossibility of seeing through bowel gas).
Frequency, penetration, resolution
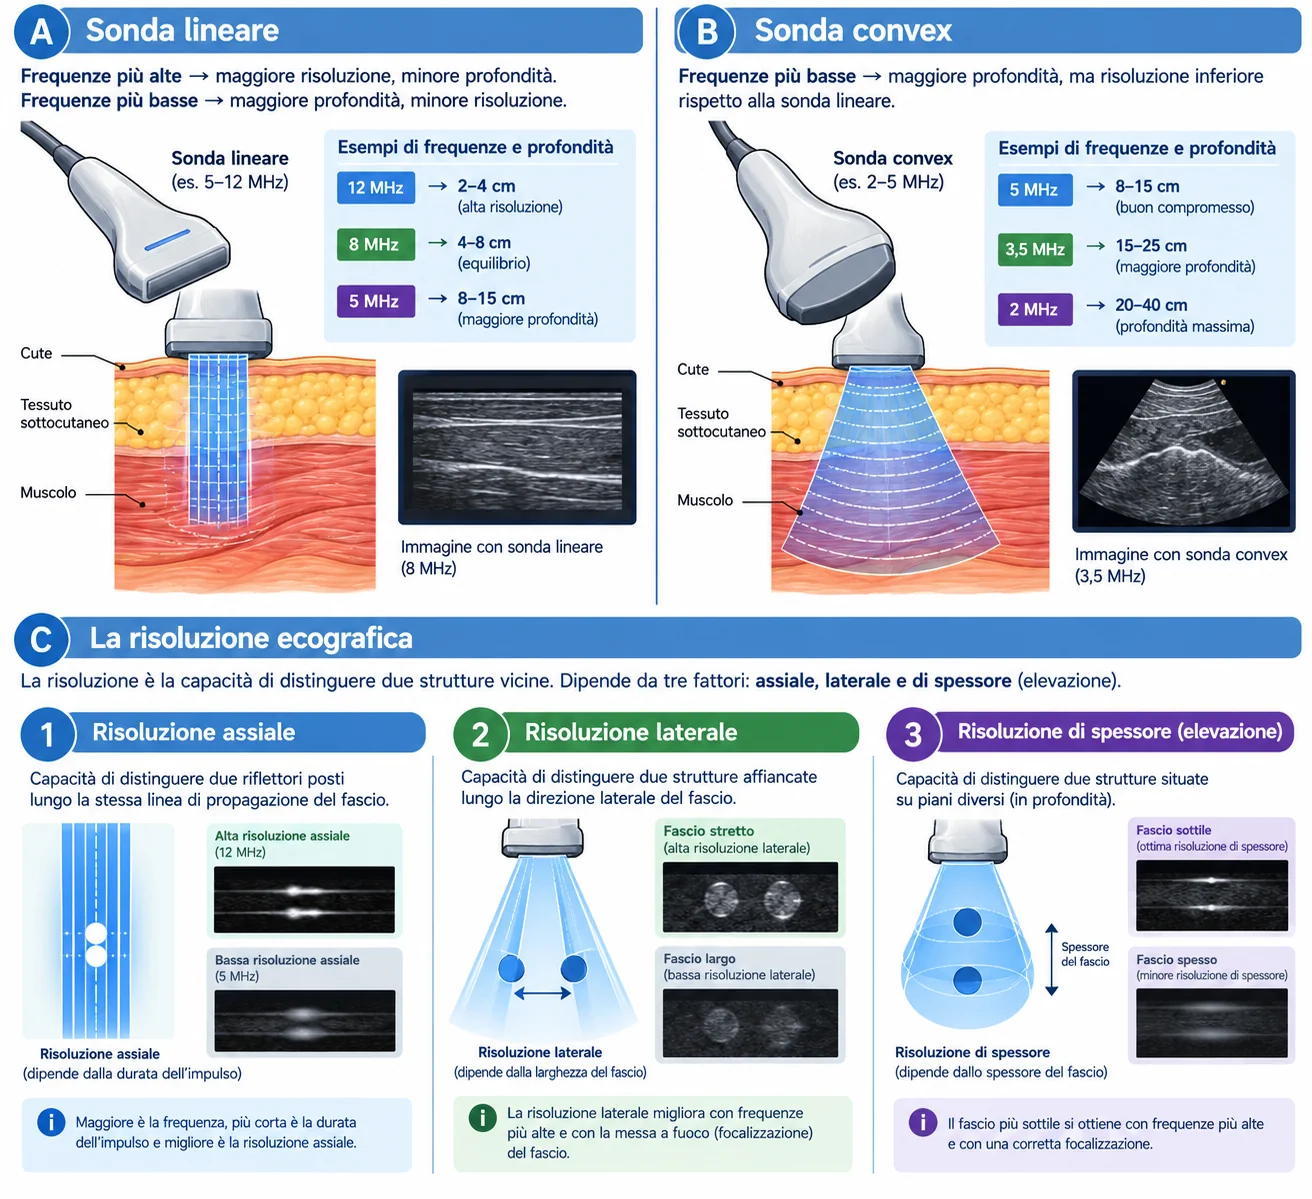
Attenuation of the ultrasound beam in soft tissue increases with frequency (roughly 0.5 dB per centimetre per MHz one way, i.e. about 1 dB/cm/MHz for the round trip): to image deep tissue well you therefore need a lower-frequency probe, while a higher frequency gives better resolution. This trade-off guides the choice of probe (e.g. a 3.5–5 MHz convex probe for greater penetration, a 12 MHz linear probe for better superficial resolution).
- Axial resolution (along the beam direction): depends on pulse length, so it improves with frequency. It is the best of the three resolutions, which is why thickness measurements — IMT, plaque thickness, diameter — should be made with the interfaces perpendicular to the beam.
- Lateral resolution (perpendicular to the beam, in the image plane): depends on beam width, and therefore on the focus. A badly placed focus widens the beam exactly where detail is needed.
- Slice-thickness resolution (out of plane): the worst of the three, and it explains why a small eccentric plaque can "disappear" or look larger depending on probe tilt.
Choice of probe
- Linear 5–12 MHz — carotid and vertebral arteries, upper and lower limbs, arteriovenous fistulas, superficial veins. Parallel beam, rectangular image, excellent resolution but limited penetration (roughly 4–6 cm).
- High-frequency linear 9–18 MHz — very superficial vessels: distal calf arteries, dorsalis pedis, saphenous veins in thin subcutaneous tissue, pre-fistula mapping.
- Convex 2–5 MHz — aorta and iliac arteries, renal and visceral arteries, vena cava, obese patients, deep vessels such as the external iliac or the distal deep femoral artery. Sector image, high penetration, lower resolution.
- Microconvex or phased array — narrow acoustic windows: supraclavicular region, retroclavicular subclavian artery, intercostal spaces.
The Doppler effect and the angle of insonation
When the beam meets moving red blood cells, the echo returns at a frequency different from the one emitted. This difference — the Doppler shift — is proportional to blood velocity, but only to its component along the beam direction.
The decisive term is cos θ. At 90° the cosine is zero: flow perpendicular to the beam produces no frequency shift, however fast it is. And it is close to 90° that the cosine changes most rapidly, i.e. where a small error in cursor alignment translates into a large velocity error.
| Angle θ | cos θ | Velocity error for a ±5° misalignment |
|---|---|---|
| 0° | 1.00 | negligible (< 1%) |
| 45° | 0.71 | about ±8–10% |
| 60° | 0.50 | about ±13–18% |
| 70° | 0.34 | about ±20–30% |
| 80° | 0.17 | from −33% to +100% |
| 90° | 0.00 | measurement impossible |
2. The angle cursor must be aligned with the direction of flow, not with the wall and not with the box: in a stenosis the jet is oblique to the vessel axis, and colour shows where it points.
3. Always use the same angle at follow-up examinations of the same patient: much of the difference between one examination and the next arises here, not from the disease.
Pulsed-wave, continuous-wave Doppler and the Nyquist limit
Pulsed-wave Doppler (PW) samples at regular intervals, with a pulse repetition frequency (PRF) limited by depth: it can therefore tell where the signal comes from, but it cannot correctly display frequencies above half the PRF (the Nyquist limit). Above that thresholdaliasingappears: systolic peaks are "cut off" and wrap around to the opposite side of the baseline.
Continuous-wave Doppler (CW), available on some dedicated probes, has no Nyquist limit and measures very high velocities, but it adds up everything it meets along the beam line, without localisation. It is the choice when velocity exceeds what PW can measure.
Optimising the B-mode image
Colour and spectrum are built on the underlying image: if B-mode is badly set, everything else will be too. The order in which you adjust the scanner is always the same.
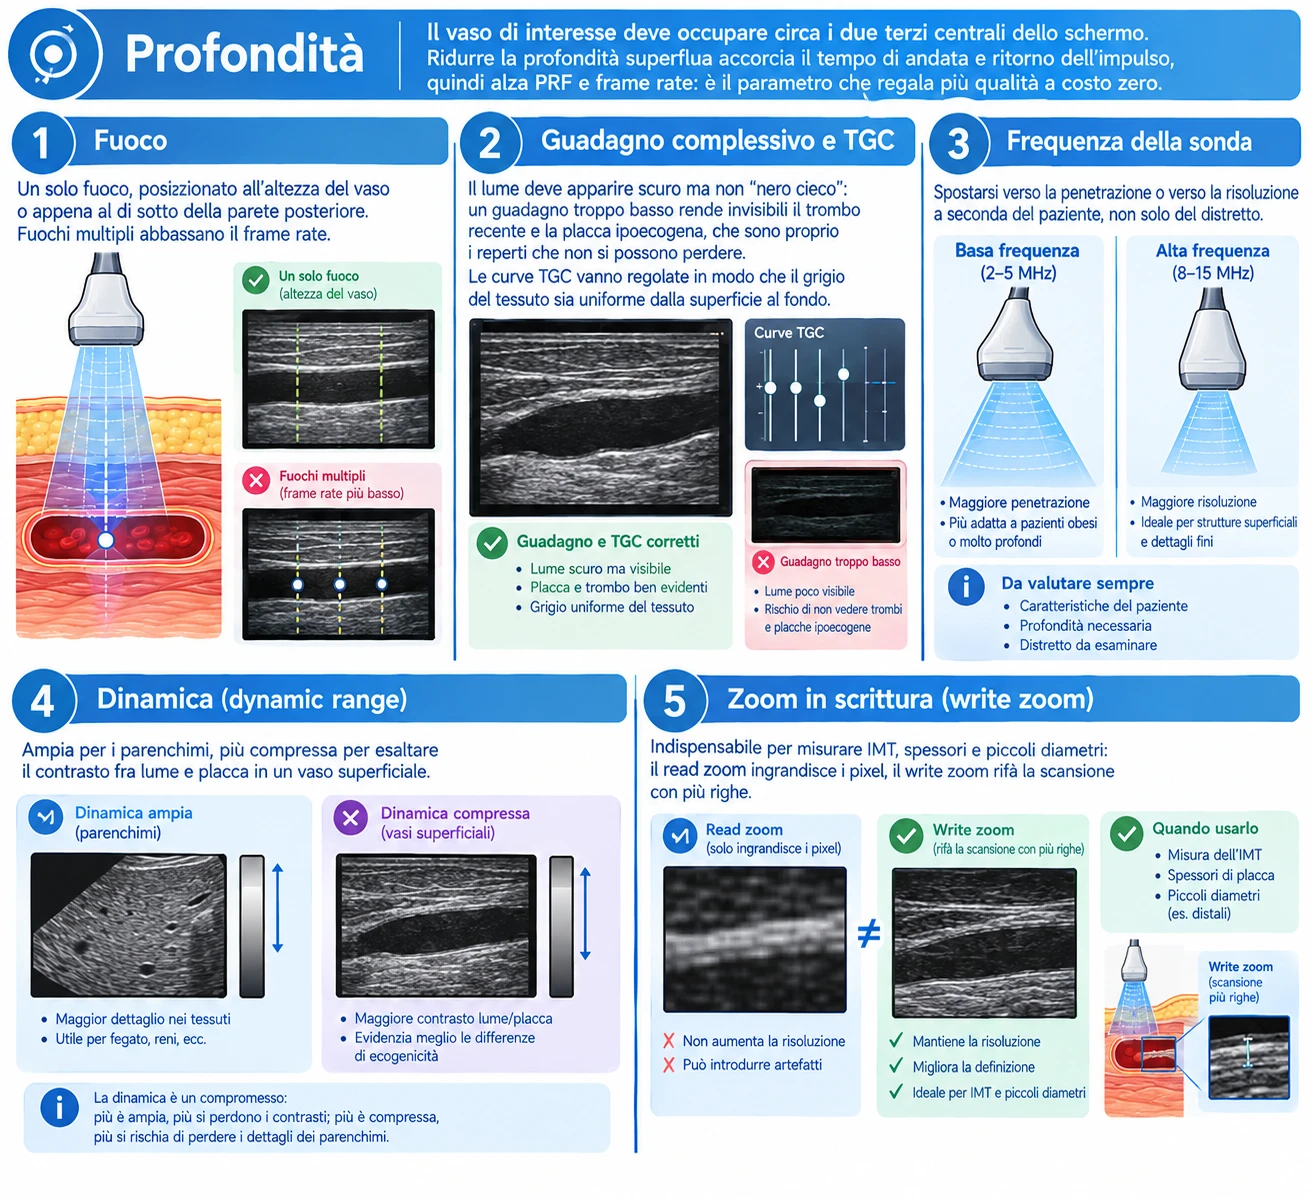
- Depth — the vessel of interest should occupy roughly the central two thirds of the screen. Removing unnecessary depth shortens the pulse round-trip time, raising PRF and frame rate: it is the parameter that gives the most quality at no cost.
- Focus — a single focal zone, placed at the level of the vessel or just below the far wall. Multiple focal zones lower the frame rate.
- Overall gain and TGC — the lumen should look dark but not "blind black": too little gain makes fresh thrombus and hypoechoic plaque invisible, and these are exactly the findings that must not be missed. TGC curves should be adjusted so that tissue grey is uniform from the surface to the bottom.
- Probe frequency — move towards penetration or towards resolution according to the patient, not only the territory.
- Dynamic range — wide for parenchyma, more compressed to enhance contrast between lumen and plaque in a superficial vessel.
- Write zoom (write zoom, not read zoom) — essential for measuring IMT, wall thickness and small diameters: read zoom enlarges the pixels, write zoom rescans with more lines.
The colour box: position, size, steering
Colour Doppler encodes in a colour map the mean Doppler shift of each small volume inside the box. Colour indicates direction relative to the probe — towards or away from it — and not the nature of the vessel: red does not mean artery, blue does not mean vein.
Size and position
- Keep the box as small as possible, just wider than the vessel. Every extra line of colour costs time: a box twice as wide halves the frame rate, and with it the ability to capture rapid events (systolic jet, brief reflux).
- The depth of the box should be limited to the vessel: colour over tissue of no interest means only noise and slowness.
- With a convex probe the beam diverges: in the centre of the sector a horizontal vessel is at 90°, at the edges it is not. Simply moving the vessel to the side of the image often gives a useful angle without changing any setting.
Steering
Electronic steering of the box, typically by 15–25°, moves the beam without moving the probe. It has a cost: a steered beam uses a smaller portion of the array and sensitivity falls, the more so the greater the steering. Use it when needed and return it to zero when the vessel is already oblique — for example at the carotid bulb, in the calf arteries or along a deep femoral axis.
The controls that matter
| Parameter | If too low | If too high |
|---|---|---|
| Colour scale / PRF | Widespread aliasing, colour mosaic in a normal vessel, overestimated velocity | Slow flow invisible: patent vein mistaken for thrombosed, near-occlusion mistaken for occlusion |
| Colour gain | Incomplete lumen, false filling defects, overestimated plaque | Colour spilling beyond the wall (blooming), stenosis masked |
| Wall filter | Wall and tissue motion artefacts | Removes slow diastolic and venous flow |
| Persistence | Noisy, "jittery" image | Artificial filling, rapid events averaged out and unrecognisable |
| Colour / B-mode priority | Colour does not appear over light grey tones | Colour covers hypoechoic plaque and leads to underestimation of the stenosis |
The sample volume and the pulsed-wave Doppler spectrum
Colour locates and orients; measurement is done with pulsed-wave Doppler. The sample volume (gate) defines which portion of the lumen the spectrum comes from, and its size should be chosen according to what you want to measure.
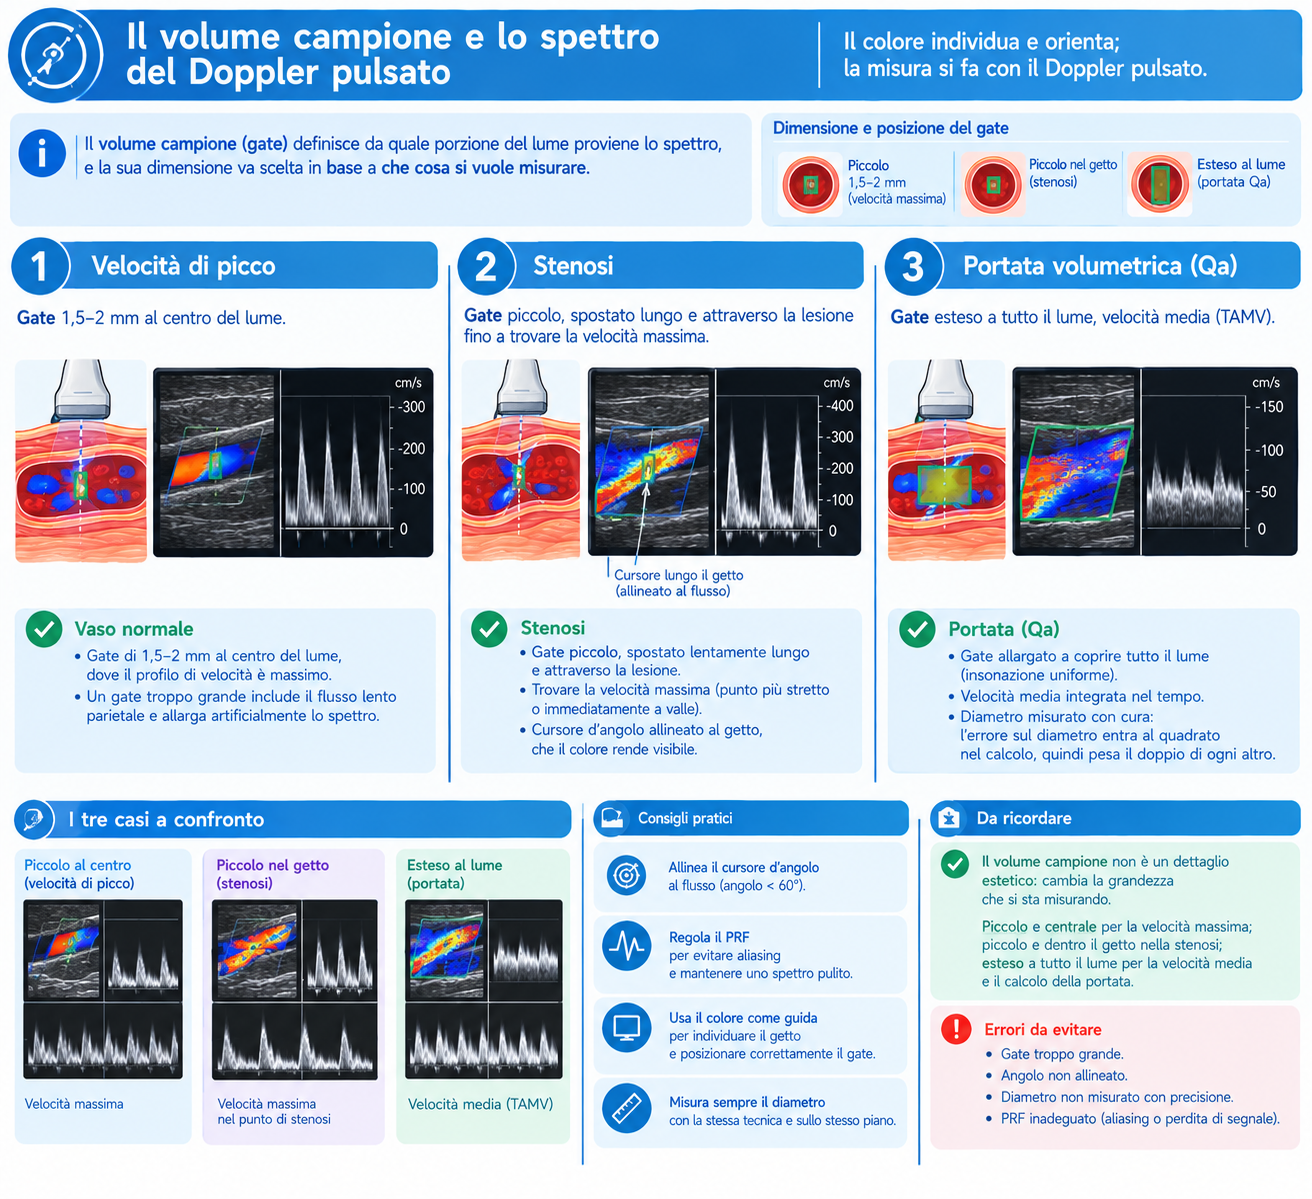
- Normal vessel — a 1.5–2 mm gate in the centre of the lumen, where the velocity profile is highest. Too large a gate includes slow flow near the wall and artificially broadens the spectrum.
- Stenosis — small gate, moved slowly along and across the lesion until the peak velocity is found, at the narrowest point or immediately beyond it. Align the angle cursor with the jet, which colour makes visible.
- Volume flow — gate opened to cover the whole lumen (uniform insonation), time-averaged mean velocity and a carefully measured diameter: the diameter error is squared in the calculation, so it weighs twice as much as any other.
Spectral settings
- Scale and baseline — the spectrum should fill two thirds of the display without aliasing and without being squashed against the baseline.
- PW gain — enough for a full trace with a sharp outline, but not so much that noise fills the spectral window under the curve.
- Wall filter — low (50–100 Hz) for venous studies and slow diastolic flow; a high filter removes diastolic flow and can lead to a mistaken diagnosis of distal occlusion or increased resistance.
- Sweep speed — 50–100 mm/s for analysing waveform shape (acceleration time, tardus-parvus); slower for dynamic manoeuvres, which need several seconds of trace: Valsalva, calf squeeze, reactive hyperaemia.
Power Doppler and other modes
Power Doppler maps the amplitude of the Doppler signal instead of its mean frequency. It loses direction and velocity information but gains sensitivity to slow flow, is practically angle-independent and is not subject to aliasing. It is the mode to use when the question is "is there flow or not?": distinguishing occlusion from near-occlusion with trickle flow, looking for recanalisation in a vein, intraparenchymal renal vessels, residual flow inside a partially thrombosed aneurysm. On the other hand it is very sensitive to motion: a single breath can fill the screen with colour (flash artefact), and high persistence makes it unsuitable for assessing temporal dynamics.
The microvascular imaging modes on recent machines (with different names from one manufacturer to another) and B-flow filter tissue motion more selectively and show slow flow with better spatial resolution: useful for the residual lumen of a plaque and for small vessels. Contrast-enhanced ultrasound has defined vascular indications — above all the search for endoleak after endovascular aneurysm repair — but is beyond the scope of the basic examination.
Presets and settings by territory
Every scanner leaves the factory with reasonable vascular presets: the useful work is to refine them once and save them, so that every examination starts from a known point rather than from the settings left by the previous patient. The values below are indicative and must be adapted to the patient and the machine.
| Territory | Probe | Colour scale | Wall filter and practical notes |
|---|---|---|---|
| Supra-aortic trunks | Linear 5–12 MHz | 25–40 cm/s (higher across stenoses) | Medium filter. Box steered over the common carotid, steering at zero at the bulb; a constant 60° angle, stated in the report |
| Lower-limb arteries | Linear 4–9 MHz; convex 2–5 MHz for iliac arteries and obese patients | 30–50 cm/s | Medium-high filter. Reduce the scale in segments beyond an occlusion, where flow is slow and damped |
| Calf arteries and dorsalis pedis | Linear 9–15 MHz | 10–20 cm/s | Low filter. Very light contact and plenty of gel: flow may be barely detectable |
| Lower-limb veins | Linear 5–9 MHz; convex for iliac veins and vena cava | 8–15 cm/s | Low filter, high persistence, generous colour gain; compression always in transverse view |
| Abdominal arteries | Convex 2–5 MHz with harmonics | 30–50 cm/s | Medium filter. 6–8 hours of fasting, brief breath-hold for sampling, deep focus |
| Renal arteries | Convex 2–5 MHz | 30–40 cm/s (lower for intraparenchymal vessels) | Low filter inside the kidney. Small box and reproducible breath-hold; power Doppler useful for segmental vessels |
| Arteriovenous fistula | Linear 5–12 MHz (convex if the access is deep) | 60–100 cm/s and above | Medium-high filter. Velocities in a mature access far exceed native ones: very high scale and wide gate for volume flow |
| Upper limbs | Linear 5–12 MHz | 20–40 cm/s (arterial), 8–15 cm/s (venous) | Low filter for veins. Microconvex for the retroclavicular subclavian; positional manoeuvres for thoracic outlet |
Longitudinal and transverse scanning
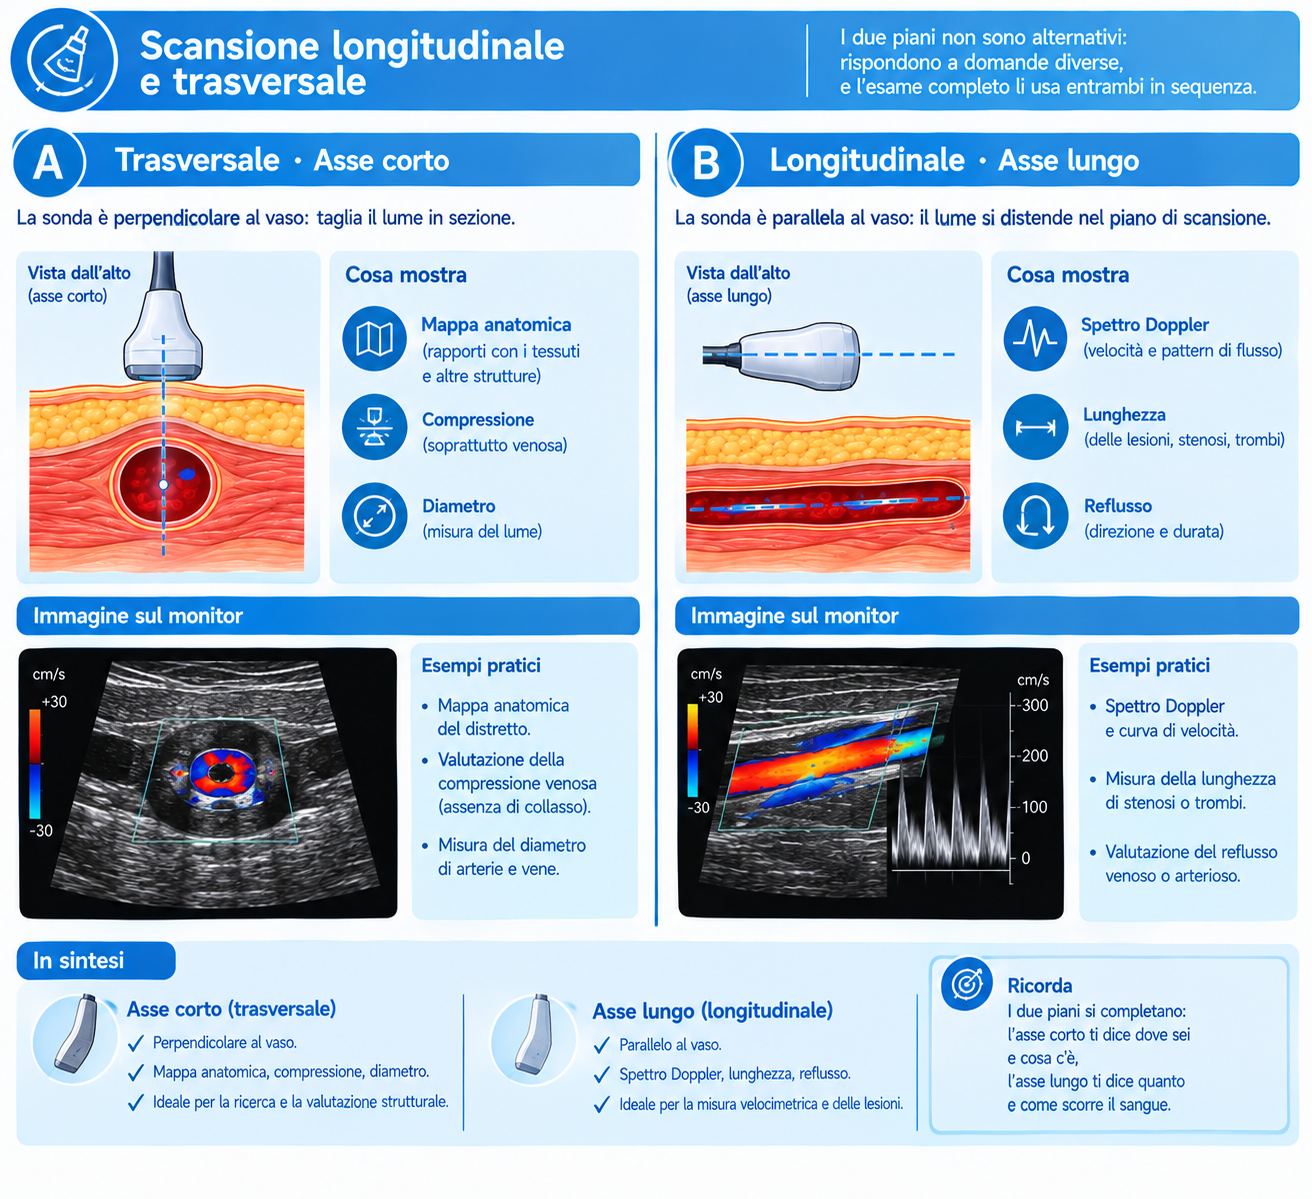
The two planes are not alternatives: they answer different questions, and a complete examination uses both in sequence.
When the transverse view is needed
- Surveying the vessel from start to finish with colour on: the quickest and safest way not to skip a segment. A diseased segment "jumps out" as a filling defect or colour mosaic.
- Venous compression: performed exclusively in transverse view. In the longitudinal view the vein slips out of the scan plane and appears compressible even when it contains thrombus.
- Diameter of the aorta and aneurysms: the measurement must be taken perpendicular to the vessel axis. In a tortuous aorta an oblique section overestimates the calibre, and it is the most common cause of aneurysms that have apparently "grown" between two checks without really doing so.
- Circumferential extent of plaque and its eccentricity, which are poorly assessed in the long axis.
When the longitudinal view is needed
- Doppler spectrum with correct angle: it is the only plane in which the flow axis can be identified and the cursor reliably aligned.
- Length of the stenosis or occlusion, distance from the origin and relationship with the bifurcation: data the surgeon or interventionist uses for planning.
- IMT and wall thickness, exploiting axial resolution on the far wall.
- Venous reflux and dynamic manoeuvres, where a continuous spectral trace is needed.
Recurrent artefacts and pitfalls
| Artefact | How to recognise it | What to do |
|---|---|---|
| Aliasing | Colour mosaic in the lumen, spectral peaks cut off and wrapped to the opposite side | Raise the scale, lower the baseline, reduce depth, increase the angle within 60° |
| 90° angle | No colour, or colour change in the middle of a curved vessel, with a normal lumen on B-mode | Steer the box or tilt the probe; never report as stenosis or occlusion |
| Acoustic shadowing from calcification | Anechoic cone behind the plaque, colour and spectrum unobtainable | Change window and plane; if it persists, state the limitation in the report and rely on the waveform downstream |
| Mirror image | Vessel or spectrum "duplicated" beyond a strong interface (pleura, clavicle, diaphragm) | Recognise the symmetry about the interface; change the angle of approach |
| Blooming / colour bleeding | Colour overflows beyond the wall and covers the plaque | Reduce colour gain and colour priority; compare with B-mode without colour |
| Twinkling | Colour scintillation behind a calcified structure | Recognise it as an artefact; sometimes useful for detecting calcification |
| Reverberation in the lumen | Linear echoes in the lumen of a superficial vessel, resembling thrombus | Change angle and depth; check with colour and power Doppler |
| Flash artefact | Sudden, diffuse filling with colour on breathing or movement | Brief breath-hold, lower persistence, higher wall filter |
| False absence of flow | "Empty" vessel with high PRF, high filter or low gain | Before writing occlusion: lower the scale, lower the filter, raise the gain, try power Doppler |
Safety and the ALARA principle
Diagnostic ultrasound does not use ionising radiation, but it deposits mechanical and thermal energy. The display shows two indices: themechanical index (MI), related to the risk of cavitation, and thethermal index (TI), which estimates tissue heating — with variants for soft tissue, bone and cranial bone.
Pulsed-wave and colour Doppler concentrate much more energy than B-mode, because they insonate the same line repeatedly. The ALARA (as low as reasonably achievable) principle therefore applies: keep acoustic output at the lowest useful level and raise receive gain instead, limit the duration of Doppler insonation at the same site, and take particular care in pregnancy and in children. In adult vascular patients the margins are wide, but good habits cost nothing.
Sources
- Hoskins PR, Martin K, Thrush A (eds), CRC Press 2019 — Diagnostic Ultrasound: Physics and Equipment, 3rd edition. Image formation, attenuation, Doppler principles, artefacts and safety.
- Kremkau FW, Elsevier 2021 — Sonography Principles and Instruments, 10th edition. Ultrasound physics, instrumentation, Doppler and bioeffects.
- Thrush A, Hartshorne T, Deane CR, Elsevier 2022 — Vascular Ultrasound: How, Why and When, 4th edition. Application to vascular scanning: angle of insonation, colour and pulsed-wave Doppler settings, artefacts.
The values in the angle-error table are calculated from the Doppler equation (the estimated velocity is inversely proportional to the cosine of the angle) for a ±5° misalignment from the set angle.